


What is a Flow Chart?
A Simple Guide to Process Mapping
Ever tried explaining a process, only to see blank stares in return? Whether it’s onboarding a new employee, troubleshooting an issue, or improving efficiency, words alone can fall short. That’s where flow charts come in—visual roadmaps that break down complex processes into simple, easy-to-follow steps.
Flow charts help teams understand, communicate, and optimize workflows by providing a clear visual of each step and decision point. From business operations to software development, they are used across industries to improve efficiency and reduce errors.
In this guide, you’ll learn:
- What a flow chart is and why it matters
- The key symbols and how to use them
- Different types of flow charts and their uses
- How to create one step-by-step
By the end, you’ll be ready to create clear, effective flow charts that enhance communication and problem-solving. Let’s get started!
What is a Flow Chart?
A flow chart is a visual representation of a process that uses standardized symbols to illustrate steps, decisions, and the flow of tasks. It’s like a roadmap for any procedure, helping teams understand how a process works at a glance.
Flow charts are widely used in business operations, manufacturing, software development, and project management to improve clarity and efficiency. Whether you’re mapping out a customer service workflow, a production process, or even the steps for making coffee, a flow chart simplifies complex tasks into logical sequences.
Why Use a Flow Chart?
Using a flow chart isn’t just about drawing boxes and arrows—it’s about making work simpler, faster, and more efficient. Here’s why they’re invaluable:
 Improved Clarity – Eliminates confusion by visually mapping out every step. Better Communication – Helps teams, especially cross-functional ones, understand workflows. Process Standardization – Ensures consistency and reduces errors. Problem-Solving – Identifies bottlenecks and inefficiencies in processes. Decision-Making Support – Provides a structured way to analyze different paths.
For example, if a production line is experiencing delays, a flow chart can help pinpoint where breakdowns occur, allowing for data-driven improvements.
Key Components of a Flow Chart
To create an effective flow chart, you need to understand its key symbols:
 Oval – Represents the Start or End of a process.
 Rectangle – Indicates a Process Step (e.g., “Mix Ingredients”).
 Diamond – A Decision Point (e.g., “Is the payment approved?”).
 Arrow – Shows the Flow from one step to another.
Here’s a simple flow chart example for making coffee:
Start Boil Water Add Coffee Grounds Pour Water Stir Drink End
By using clear symbols and logical flow, even complex processes become easy to understand and follow.
Types of Flow Charts and When to Use Them
Not all flow charts are the same. Depending on what you’re trying to visualize, different types of flow charts can help break down processes in the most effective way. Below are the most common types and where they are used.
1. Process Flowchart (Traditional Flowchart)
 Best for: Manufacturing, business processes, Lean improvements
A Process Flowchart is the most commonly used type. It maps out a step-by-step sequence of tasks in a process, helping to identify inefficiencies and standardize operations.

Example Use Case: Manufacturing workflows (e.g., how raw materials move through production) Customer service procedures (e.g., handling returns or complaints) Employee onboarding process
Learn More – Process Flow Chart
2. Swimlane Diagram

Best for: Identifying responsibilities across departments
A Swimlane Diagram divides a process into different lanes, showing who is responsible for what. This is perfect for cross-functional processes where multiple teams or roles are involved.
Example Use Case: Order fulfillment process (Warehouse → Shipping → Customer Service) Product development workflow (Design → Engineering → QA → Release)
3. Decision Flowchart
Best for: Visualizing decision-making paths
This type of flowchart focuses on decision points, helping teams map out different choices and outcomes. It’s especially useful in troubleshooting and quality control processes.
Example Use Case: IT troubleshooting (e.g., “Is the internet working? Yes → Continue. No → Restart router.”) Medical triage processes (e.g., “Is the patient critical? Yes → Emergency. No → Schedule appointment.”)
4. Data Flow Diagram (DFD)
Best for: Software development, IT, and system design
A Data Flow Diagram (DFD) tracks how data moves through a system, showing inputs, processes, storage, and outputs. It’s commonly used in software engineering and database design.
Example Use Case: Tracking user data in a website application Mapping how financial transactions flow through an accounting system
5. Value Stream Map (VSM)
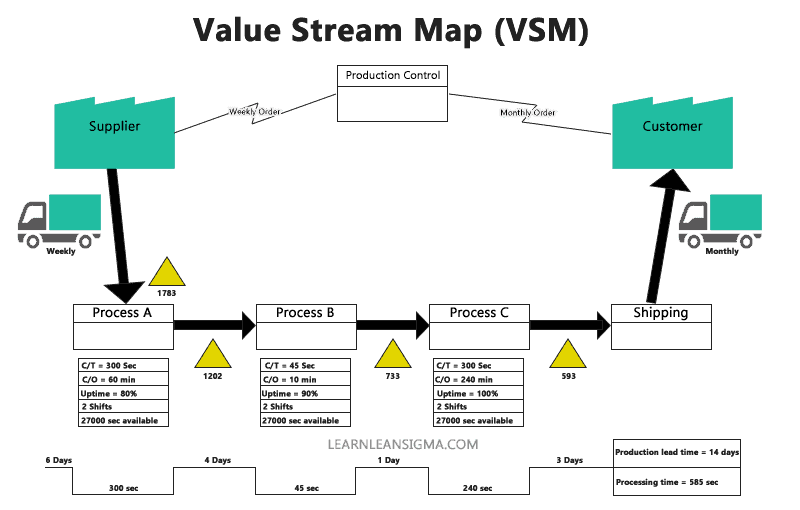
Best for: Lean Manufacturing and Continuous Improvement
A Value Stream Map (VSM) is a specialized flowchart used in Lean and Six Sigma to visualize how materials and information flow across a process. It identifies waste and inefficiencies in production.
Example Use Case: Reducing lead time in a manufacturing plant Mapping bottlenecks in supply chain logistics
Choosing the Right Flow Chart
To pick the right type, ask: Do I need to show roles and responsibilities? → Use a Swimlane Diagram Am I mapping decisions and their consequences? → Use a Decision Flowchart Is this about optimizing a production or business process? → Use a Process Flowchart or VSM Do I need to track data movement? → Use a Data Flow Diagram
How to Create a Flow Chart Step-by-Step
Creating a flow chart doesn’t require fancy tools or artistic skills—just a clear understanding of the process you want to map out. Follow these five simple steps to create an effective flow chart.
Step 1: Define the Process
Before you start drawing, clearly define the process you want to map. Ask yourself:
- What is the start and end of the process?
- What are the major steps involved?
- Are there any decision points (e.g., approvals, conditions)?
 Example: If you’re creating a flow chart for handling customer complaints, the process might start with “Customer Submits Complaint” and end with “Issue Resolved.”
Step 2: Identify Key Steps and Decisions
Break the process into logical steps. Consider: Actions – What happens at each stage? Decisions – Are there choices that change the flow? Roles – Who is responsible for each step?
Example: In a hiring process flow chart, key steps might include: Receive Job Application
 HR Review Application
 Decision: Is the candidate qualified? (Yes → Schedule Interview, No → Send Rejection Email)
Step 3: Choose the Right Symbols
Using standard flowchart symbols ensures clarity:
Oval – Start/End Rectangle – Process Step Diamond – Decision Point Arrow – Direction of Flow
Example: In an IT troubleshooting flow chart, a diamond might represent a question like “Is the device connected to Wi-Fi?” with arrows leading to different actions based on the answer.
Step 4: Arrange in a Logical Flow
Your flow chart should be easy to follow from top to bottom or left to right.
- Avoid unnecessary loops or dead ends.
- Keep spacing even so it’s visually clear.
- Use labels if needed to clarify specific steps.
Pro Tip: If multiple roles are involved, use swimlanes to separate responsibilities.
Step 5: Review and Refine
Before finalizing, test your flow chart by asking: Does it cover all key steps? Is it easy to understand at a glance? Are decision points clearly mapped? Can any steps be simplified or removed?
Get feedback from colleagues or stakeholders to ensure accuracy and clarity.
Tools to Create Flow Charts
You can draw flow charts by hand, but digital tools make it even easier:
Lucidchart – Intuitive drag-and-drop flowchart maker
Microsoft Visio – Great for business process mapping
Miro – Best for collaboration with teams
Draw.io (Free!) – Simple and effective online tool
Conclusion
Flow charts aren’t just diagrams—they’re powerful tools that streamline communication, eliminate confusion, and improve process efficiency. Whether you’re mapping a business workflow, troubleshooting an issue, or optimizing a production line, a well-structured flow chart can make complex processes clear and actionable.
Here’s a quick recap of what we covered: What a flow chart is and why it’s valuable The key symbols and their meanings Different types of flow charts and their best use cases A step-by-step guide to creating your own flow chart Common pitfalls to avoid for better clarity
References
- Malinova, M. and Mendling, J., 2013. The effect of process map design quality on process management success.
- Heinrich, B., Henneberger, M., Leist, S. and Zellner, G., 2009. The process map as an instrument to standardize processes: design and application at a financial service provider. Information systems and e-business management, 7, pp.81-102.